Reducing DAX Complexity in Large Power BI Models
“This model is too complex” usually gets said as if complexity were one thing. It isn’t. In a DAX model it shows up in three measurable forms: depth (measure-on-measure chains stacking up), sprawl (hundreds of measures, many duplicated or dead), and opacity (names and definitions that tell a reader nothing). Each form has a different fix, and none of them requires a rewrite. Everything below is an incremental move you can make on a live model, one measure at a time.
First, know which complexity you have
A quick self-assessment before touching anything:
- Depth: pick your three most-used top-level measures. Can you say how many layers sit beneath each? If the answer is “no idea,” depth is unmanaged.
- Sprawl: how many measures does the model contain, and how many could you personally vouch for? A large gap between those numbers is the finding.
- Opacity: could a new developer identify which measures are foundational just by looking at the field list? If foundations are indistinguishable from experiments, opacity is the problem.
Most large models have all three. The tactics below address them in order of impact.
Tactic 1: VAR/RETURN for private intermediates
The single most effective depth-reducer is deciding which intermediate calculations deserve to be measures at all. Every intermediate measure is a public object — anything can reference it, which means anything eventually will, and your chain grows another accidental layer. A VAR is the alternative: the same intermediate computed locally, invisible outside its measure.
Here’s the move.
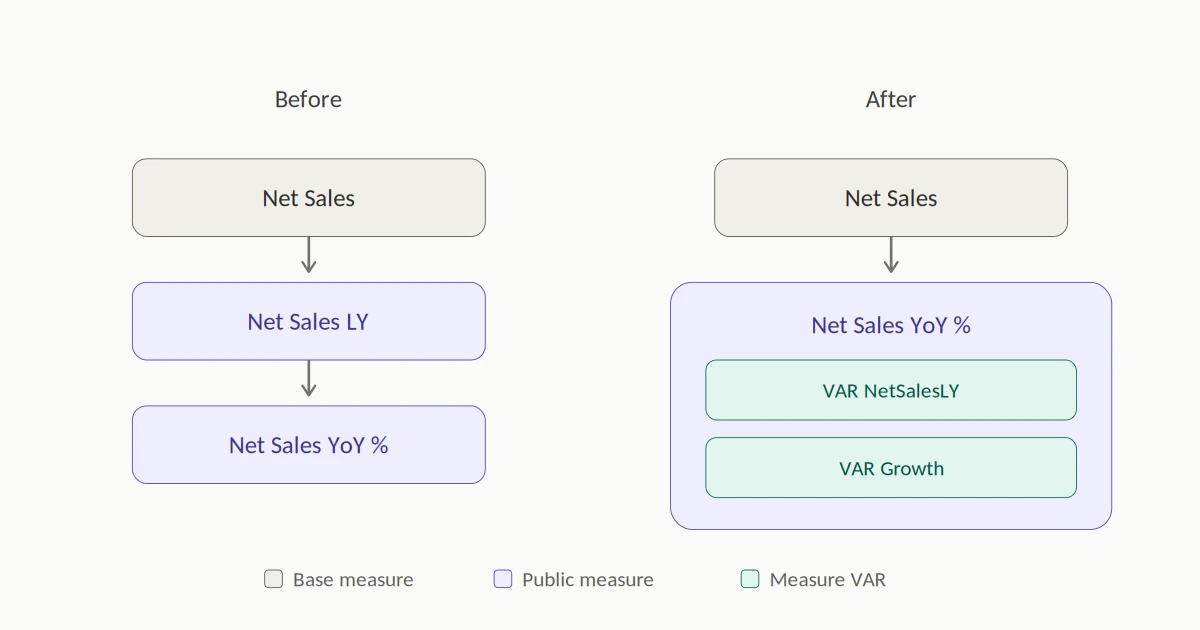
Before (three public measures deep):
Net Sales LY = CALCULATE([Net Sales], DATEADD('Date'[Date], -1, YEAR))

Net Sales YoY % =
DIVIDE([Net Sales] - [Net Sales LY], [Net Sales LY])
After (the intermediate collapsed into variables):
Net Sales YoY % =
VAR NetSalesLY =
    CALCULATE([Net Sales], DATEADD('Date'[Date], -1, YEAR))
VAR Growth = [Net Sales] - NetSalesLY
RETURN
    DIVIDE(Growth, NetSalesLY)
Net Sales LY no longer exists as a public object. Nothing can build on it, so it can never silently become load-bearing. That’s one of four distinct benefits:
- No accidental foundations. A variable cannot be referenced by other measures. The intermediate is permanently private, so the chain can’t grow through it.
- Readability and debugging in one place. The whole calculation reads top to bottom in a single definition. Debugging is direct: temporarily change the
RETURNto output any variable and inspect each step in isolation. - Performance. A variable is evaluated once and reused within the measure. A referenced measure, by contrast, is re-evaluated in context each time it appears in complex expressions, converting repeated references to a single
VARis a genuine optimization, not just style. - Contained blast radius. Editing a variable affects exactly one measure. Editing a base measure affects everything above it.
Now the limits. VAR trades reuse for locality. If ten measures need last-year net sales, in-lining that logic into all ten reintroduces exactly the duplication that shared base measures exist to prevent the disease measure chains cure. And the chain shrinks rather than vanishes: even a fully in-lined measure still depends on the columns, tables, and relationships it touches.
Which yields the heuristic that governs this whole tactic:
Use a VAR for logic only this measure needs. Use a base measure for logic several measures share.
Depth that comes from genuinely shared logic is good depth. Its a single source of truth. Depth that comes from “I made everything a measure out of habit” is the depth VAR eliminates for free.
Tactic 2: Deliberate base-measure tiers
The complement to Tactic 1: the shared logic that does deserve to be public should be deliberately public. Designate a small foundational tier, measures ike Sales, Net Sales, or Cost and hold it to different standards: boring, stable definitions; documented first; changed rarely and carefully. Everything else builds on the foundation tier and, ideally, doesn’t get built upon itself.
The result isn’t a shallower model so much as a shaped one: many short chains converging on a few well-known foundations, instead of an undifferentiated web where any measure might secretly be load-bearing. Unplanned depth is the problem; planned depth is architecture.
Tactic 3: Kill sprawl
Dead and duplicated measures are the only complexity with zero payoff. They deepen nothing and share nothing; they just sit in the field list making every search slower and every audit longer. Duplicates are worse than dead weight: two near-identical “total sales” measures drifting apart is how a model loses stakeholder trust.
The cleanup process is its own discipline. finding unused measures covers it, but in a complexity context the point is simpler: reducing the object count is the cheapest complexity win available, because nothing depends on the objects you’re removing. Do this one before the harder tactics; a smaller model makes every other change easier to reason about.
Tactic 4: Name and document for the reader
Opacity is complexity’s force multiplier meaning a deep chain of well-named, documented measures is navigable; a shallow model of Measure 7 and Test_v2_new isn’t. Two cheap habits: naming that encodes the tier (a convention that makes Sales obviously foundational and Net Sales YoY % (EMEA) obviously a leaf), and a one-line business definition on every measure, written when you create it. This is the habit from documenting a Power BI data model that’s easy in the moment and brutal to retrofit.
Measuring whether it worked
Complexity reduction without measurement is vibes. The dependency graph gives you real before/after numbers: the depth distribution across the model, how many measures act as foundations (and whether they’re the ones you chose), and the raw object count. Pull the dependency trees before you start, run your cleanup, pull them again. DAX Prism generates these on demand, which turns “the model feels simpler” into “maximum depth went from eleven to six and forty dead measures are gone.”
That’s the standard to hold the work to. Not simpler-feeling, but measurably shallower, smaller, and clearer.
Frequently asked questions
Are deep dependency chains always bad? No. Depth from shared base measures is a single source of truth and usually better than duplicated logic. The problem is unplanned depth, chains nobody designed, running through measures nobody realized were foundational.
Does VAR actually improve DAX performance? It can. A variable is evaluated once and reused within its measure, while a referenced measure is re-evaluated in context at each reference. Collapsing repeated references into one VAR removes real redundant work in complex expressions.
Should I convert all my measures to VARs? No. Convert intermediates that only one measure needs. Logic shared by several measures belongs in a base measure and inlining it everywhere trades a visible chain for invisible duplication, which is worse.
How deep is too deep? There’s no universal number; the honest threshold is comprehension. If understanding a top-level measure requires holding more layers in your head than a competent developer reasonably can, and the depth wasn’t a deliberate design choice, it’s too deep.