How to Trace Measure Dependencies in DAX
You’re about to tweak a measure called Base Sales. It looks simple. But forty other measures reference it, some directly, some through three or four layers of nesting. Changing it could quietly shift numbers on dashboards you’ve never opened. The problem isn’t the edit. It’s that the chain of dependencies is invisible in Power BI’s standard interface. This guide explains what measure dependencies are, how to trace them by hand, where the manual approach breaks down, and how to map the full chain in seconds before you touch anything.
What “measure dependencies” actually means
A dependency is simply one object relying on another. In a DAX model, dependencies run in several directions:
- A measure references other measures —
Profit MargindividesProfitbySales. - A measure references columns —
SalessumsSales[Amount]. - A column or measure depends on a relationship — filtering one table to another only works if the relationship exists and is active.
- Calculated columns can reference other columns and even tables.
The result is a web. A single top-level measure on a report visual can sit on top of a chain ten objects deep. Trace the chain and you know exactly what a change will affect; ignore it and you’re editing blind.
Why it matters before you change anything
Three concrete reasons to map dependencies first:
- Avoid silent breakage. Editing a base measure can change every measure built on it. The visuals using those downstream measures won’t error — they’ll just show different numbers, which is far harder to catch.
- Safe deletion. Before removing a measure, you need to know nothing depends on it. (More on that in safely deleting measures without breaking visuals.)
- Faster onboarding and audits. When you inherit a model, the dependency chain is the map of how the logic fits together.
How to trace dependencies manually
You can do this by hand for a small model. The workflow is something like this:
- Pick your starting measure and open its DAX definition.
- List every object it references — other measures, columns, tables.
- Open each referenced measure and repeat, noting what it references.
- Keep going until you reach measures that only reference columns (the bottom of the chain).
- Record the tree — indented text or a simple diagram showing parent-to-child references.
For relationships, check the model view to confirm which relationships the filtering relies on, and whether any are inactive and activated with USERELATIONSHIP.
This works, but it’s slow and fragile. Miss one nested reference and your map is wrong in exactly the place that matters. On a model with hundreds of measures, manual tracing stops being realistic.
A faster way: automated dependency trees
Because every dependency is already encoded in the DAX, a tool can parse the definitions and build the full tree for you. This means every measure, the measures they reference, and the columns and tables underneath, all the way down. Instead of opening definitions one at a time, you see the entire chain for any measure at a glance, including the deep nesting that’s easiest to miss by hand.
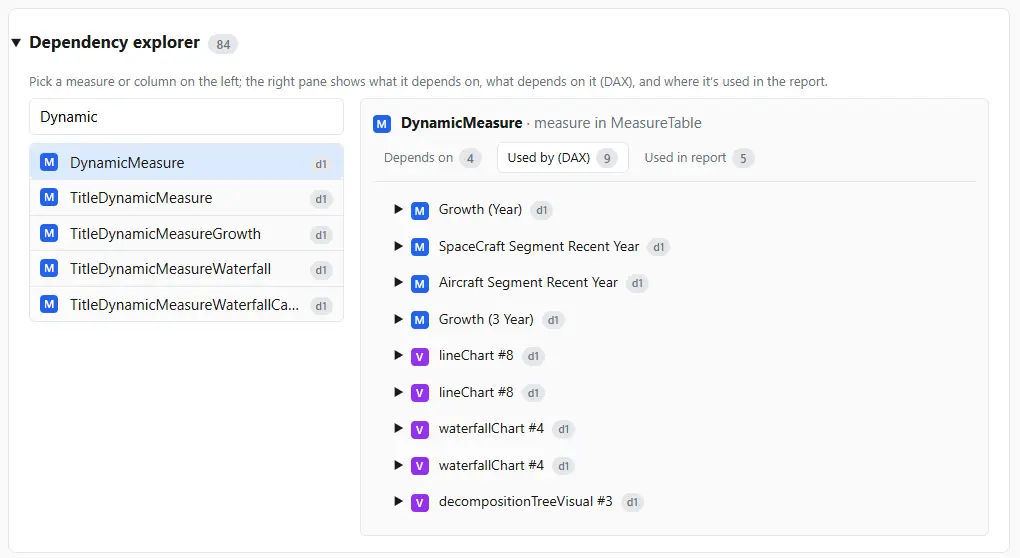
This is one of the features that DAX Prism has: pick a measure and get its complete dependency tree in seconds, then trace upward to see everything that depends on it before you make a change. It’s the difference between hoping you caught every reference and knowing you did.
Reading the chain in both directions
Dependency tracing is most useful when you can read it two ways:
- Downstream (what does this measure rely on?) — for understanding and debugging. If a number is wrong, walk down the chain to find the base measure or column at fault.
- Upstream (what relies on this measure?) — for change impact and safe deletion. Before you edit or remove an object, walk up to see everything that would be affected.
Both views come from the same dependency graph; you’re just traversing it in opposite directions.
Frequently asked questions
Can Power BI show measure dependencies natively? Not as a full tree. You can open each measure’s DAX and read its references manually, but Power BI doesn’t render the complete nested chain for you, which is why people turn to external tools.
What’s the difference between a dependency and a relationship? A relationship is a defined link between two tables. A dependency is broader — it includes relationships, but also one measure referencing another, or a measure referencing a column.
How deep can dependency chains go? There’s no fixed limit. In large models, chains ten or more levels deep are common, especially where teams build measures on top of other measures over time.
Why trace dependencies before deleting a measure? Because deleting a measure that something else references will break those downstream measures and the visuals built on them. Tracing upstream first tells you whether anything depends on it. See how to safely delete measures.
Does this relate to documenting a model? Directly. The dependency tree is a core part of model documentation, see how to document a Power BI data model for the full process.
Can you avoid dependencies altogether?
You can reduce measure-on-measure nesting with variables (VAR and RETURN) by computing intermediate values inline. But dependencies aren’t inherently bad — a shared base measure is a single source of truth, which is usually better than duplicating the same logic across many measures. And even with variables, a measure still depends on the columns, tables, and relationships it touches, so the chain shrinks rather than disappears. Either way, you still need to trace what pages and visuals depend on a given measure.