How to Document a Power BI Data Model
If you’ve ever inherited a Power BI report with 500 measures (half of which are nested), no comments, created by a data analyst who left the company months ago, you already know why documentation matters. A well-documented data model is the difference between confidently changing a measure and praying you didn’t just break three dashboards. This guide walks through how to document a Power BI data model from scratch. It tells you what to capture, the order to do it in, and where automation saves you hours. By the end you’ll have a repeatable process and a clear sense of when manual notes are enough and when a tool earns its keep.
What “documentation” actually covers
Documentation isn’t a single artifact, it’s a description of every part of your model that future you (or a future coworker) needs to understand. At minimum, that means:
- Tables — what each one represents, its source, and its grain (one row per what?).
- Columns — data types, hidden vs. visible, and any that exist only to support a calculation.
- Measures — the business definition in plain language, not just the DAX.
- Relationships — cardinality, filter direction, and whether any are inactive.
- M / Power Query steps — where the data comes from and how it’s transformed.
- Row-level security (RLS) — who can see what, and the roles that enforce it.
A useful rule of thumb: if losing the information would force someone to reverse-engineer the model, it belongs in the docs.
Step 1: Inventory your model
Start with a complete list of what exists before you describe any of it. Open your model view and catalog every table, then every measure, then every relationship. A simple spreadsheet with one row per object and columns for name, type, purpose, and source is enough to begin.
This inventory step is boring but essential — it surfaces the orphaned tables, the duplicate measures, and the “temp” calculations that quietly shipped to production. You can’t document what you haven’t found.
Step 2: Capture data sources and Power Query
Work in the direction the data flows, starting at the source. For each table, record the source system, the connection type (import, DirectQuery), and a short summary of the key Power Query transformations. Anyone debugging a refresh failure or a wrong number will start here.
Step 3: Map relationships
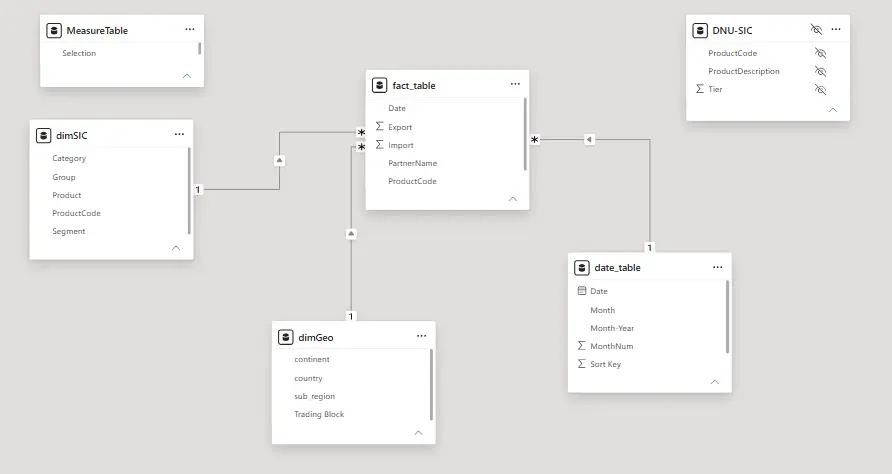
Document each relationship’s two tables, the cardinality (one-to-many, many-to-many), the filter direction, and whether it’s active. Inactive relationships deserve a note explaining why they’re inactive and which measure activates them with USERELATIONSHIP.
Step 4: Document measures and dependencies
Measures are where the real logic (and the confusion) lives. For each one, write a one-sentence business definition above the DAX. “Total Sales excluding intercompany transactions, current year only” tells a reader far more than the formula alone. This is far easier to do during development than to retrofit later, so build the habit early.
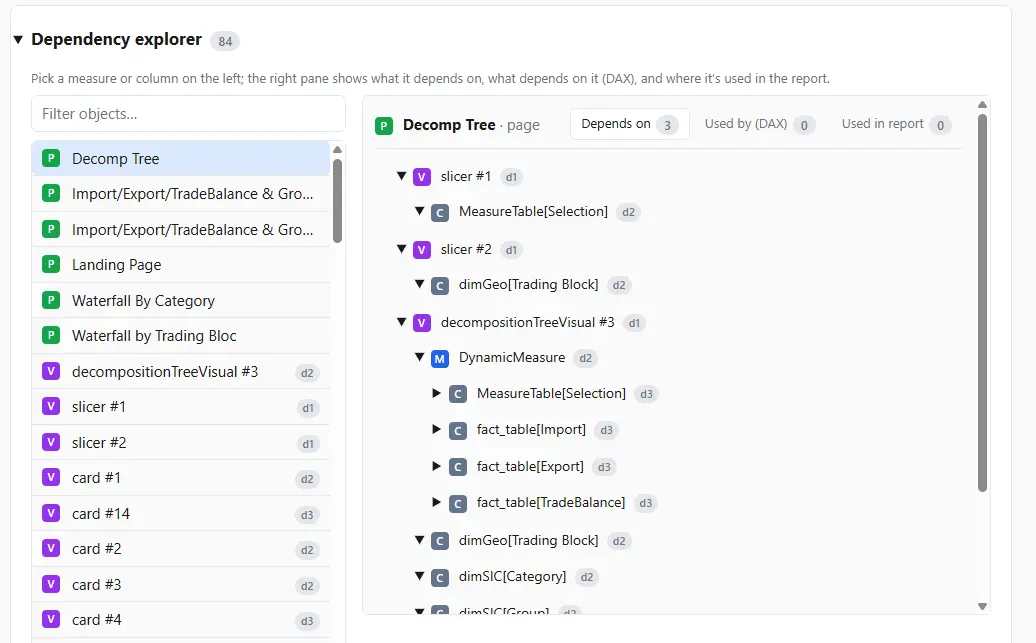
The harder part is dependencies. Measures reference other measures, which reference columns, which depend on relationships. Changing one base measure can ripple through a dozen others, and that chain is invisible in the standard Power BI interface. Mapping it by hand is tedious and error-prone, which is exactly the problem tracing measure dependencies in DAX solves. A dependency tree shows you the full chain before you touch anything.
Step 5: Verify pages and visuals with stakeholders
Finish where the end user does with the report pages. Walk through each visual with your stakeholders to confirm it communicates the metric they actually need, and that the pages organize those visuals in an order that makes sense to the people reading them. Documentation here is as much about intent as mechanics: note what each page is for.
Step 6: Keep it current
Documentation that’s accurate on day one and stale by day thirty is worse than none, because people trust it. Build maintenance into your workflow: update the docs in the same pull request as the model change, and treat out-of-date documentation as a bug. Storing your documentation as text alongside the model also lets you version-control your Power BI documentation, so every change is tracked and reviewable like code.
Manual vs. automated documentation
For a small model you maintain alone, manual documentation in a spreadsheet or wiki is perfectly reasonable. The trade-off shifts as models grow and teams change hands.
| Manual | Automated | |
|---|---|---|
| Setup time | Low | Low–medium |
| Time per model | High, grows with size | Minutes, regardless of size |
| Stays current? | Only with discipline | Re-run on demand |
| Captures dependencies | Rarely (too tedious) | Yes, automatically |
| Best for | Small, stable, solo models | Large, evolving, or team-owned models |
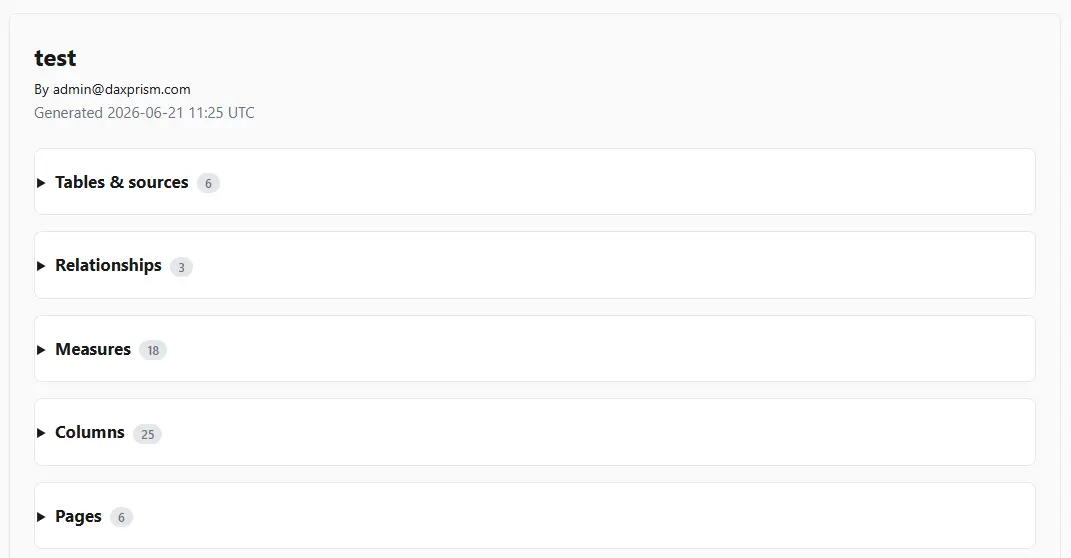
The honest summary: manual works until it doesn’t. Once a model is big enough that the dependency chains matter, or once more than one person touches it, automated documentation pays for itself on the first inherited report. Tools like DAX Prism generate the inventory, measure definitions, and dependency trees in minutes, then let you re-run as the model evolves.
Frequently asked questions
How long does it take to document a Power BI model? Manually, anywhere from a few hours to a few days depending on the number of measures and relationships. Automated tools reduce this to minutes for the structural parts, leaving you to add business context.
Can you auto-generate Power BI documentation? Yes. Tools can extract tables, columns, measures, relationships, and dependency chains directly from the model file and produce a readable document, which you then enrich with plain-language definitions.
What’s the difference between documentation and a data dictionary? A data dictionary is the reference list of fields and their definitions — a subset of documentation. Full documentation also covers relationships, transformations, security, and the reasoning behind design choices.
Do I need to document hidden columns and helper measures? Absolutely. Hidden helpers are the objects most likely to confuse a future maintainer precisely because they don’t appear in the report.
How do I keep documentation from going stale? Update it in the same change as the model edit, store it as version-controlled text, and regenerate the automated portions on a schedule.
What should I document first on an inherited report? Start at the beginning and work your way to the end:
- Understand the data sources
- Then Power Query transformations
- Next the relationships
- Now the DAX measures / calculated columns
- Finally the pages and the visuals
Work with your stakeholders to verify that your visuals are clearly communicating the metrics and analytics they need to do their jobs, and that the pages organize those visuals in a manner that makes sense to the end user.