What Is a Measure Dependency Tree?
You get pinged by one of your stakeholders. One of their key metrics looks “off.” You open up Power BI to check Profit Margin %. The DAX is fine, but what the measure sits on has changed with your latest update. Which other measures does it call? Which columns do those touch? If a number looks wrong, where in that stack is the fault?
A measure dependency tree is the answer. It’s a hierarchical map showing every object a DAX measure depends on. It shows other measures, columns, tables, and relationships. A measure dependency tree starts from the measure at the root and expands down to the raw columns at the bottom. It turns a chain that’s scattered across dozens of DAX definitions into a single picture you can read at a glance.
The anatomy of a dependency tree
Every dependency tree has the same three parts:
- The root — the measure you’re asking about.
- The branches — the measures it references, and the measures those reference, nested as deep as the chain goes.
- The leaves — the columns and tables at the bottom. A leaf is where the logic stops and the data starts.
Here’s a small real-world example:
Profit Margin %          ← root: the measure you picked
├── Profit               ← branch: a referenced measure
│   ├── Sales            ← branch: nested one level deeper
│   │   └── Sales[Amount]        ← leaf: a column
│   └── Cost
│       └── Sales[CostAmount]    ← leaf
└── Sales                ← the same branch can appear twice
    └── Sales[Amount]
Two things this little tree already reveals that the DAX for Profit Margin % alone never would: the measure is three layers deep, and everything ultimately rests on two columns. If Sales[Amount] is wrong, every number in this tree is wrong.
Real trees are rarely this tidy. In models where teams build measures on top of measures for years, chains ten or more levels deep are common. That depth is precisely what makes the tree worth drawing.
Reading the tree in two directions
The same tree answers two different questions depending on which way you walk it:
- Downstream — “what does this measure rely on?” Start at the root and read toward the leaves. This is the debugging direction: when a number is wrong, walk down until you find the branch or leaf at fault.
- Upstream — “what relies on this measure?” Flip the perspective: put a measure at the center and look at everything above it. This is the change-impact direction — before you edit or delete a measure, the upstream view tells you exactly what would be affected.
Both views come from the same underlying graph; you’re just traversing it in opposite directions. Tracing measure dependencies in DAX covers the full method for doing both.
Why you can’t see the tree in Power BI
Power BI knows about every one of these dependencies, but the interface never draws the tree. The formula bar shows you one measure’s DAX at a time. Lineage view, despite the promising name, operates at the level of dataflows, datasets, and reports, not individual measures. So the tree exists implicitly in your model, and the only native way to see it is to open definitions one by one and hold the structure in your head.

That works for a five-measure model. At fifty measures it’s slow; at five hundred it’s a guessing game, and guessing is exactly what dependency questions punish.
How the tree gets built
The good news: because every reference is written down in the DAX, the tree doesn’t have to be assembled by hand. A tool can parse all the measure definitions in a model, extract every reference, and construct the complete tree for any measure in seconds, including the deep nesting that’s easiest to miss when reading definitions manually. That’s what DAX Prism does: pick a measure, get its full dependency tree, and traverse it in either direction before you change anything.
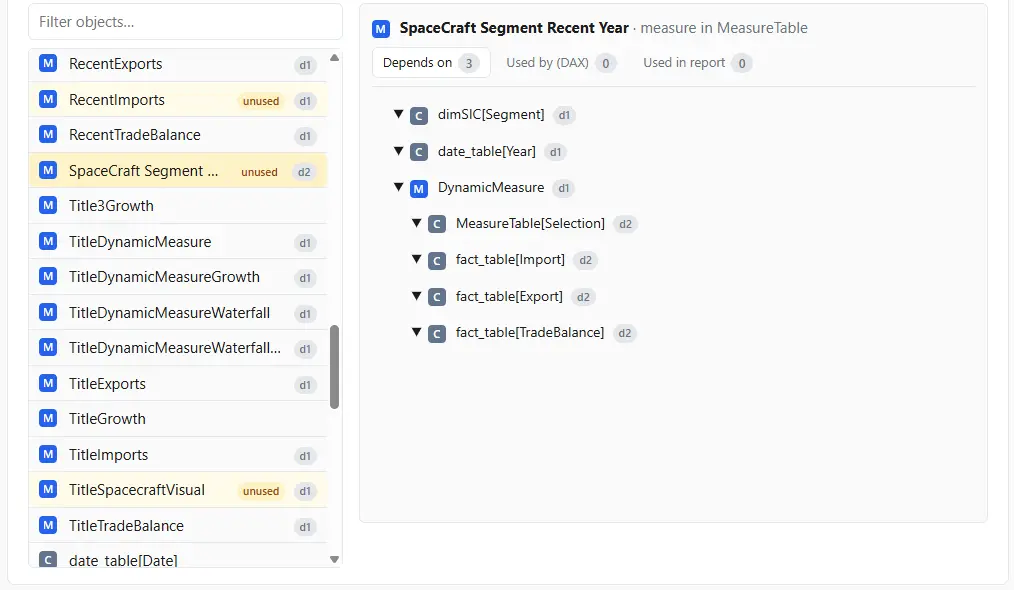
Once you have the tree, it stops being a diagram and starts being a tool. You can use it for debugging, for safe cleanup, and for understanding a model someone else built.
Frequently asked questions
Is a dependency tree the same as Power BI’s lineage view? No. Lineage view shows how datasets, dataflows, and reports connect to each other, the artifact level. A dependency tree operates inside the model, showing how one measure connects to other measures, columns, and tables.
How deep can a dependency tree go? There’s no fixed limit. Simple models may only nest one or two levels; in large models built up over years, chains ten or more levels deep are common.
Does every measure have a dependency tree? Yes, though the simplest ones are trivial: a measure that only sums a column has a root and a single leaf. The tree becomes valuable as soon as measures start referencing other measures.
Can columns and tables have dependency trees too? Yes. Calculated columns reference other columns and measures, and calculated tables reference tables and expressions, so the same tree structure applies. Measures just tend to have the deepest and most consequential chains.